In 2025, staying ahead means understanding how the numbers tell the story. From customer satisfaction scores to AI adoption rates, these call center statistics reveal where the industry stands and where it’s heading next.
Key Takeaways
- The most successful call centers use statistics not just to measure performance but to understand the “why” behind their numbers and take targeted action.
- Metrics like FCR, CSAT, and service level are reflections of how well your call center meets customer expectations.
- AI, automation, and cloud-based tools don’t replace agents; they empower them to focus on meaningful, high-value interactions.
- Comparing your KPIs to industry standards helps pinpoint where your team excels and where small changes can lead to big performance gains.
- Tracking, analyzing, and acting on your call center data ensures that your team stays adaptable, efficient, and ready for what’s next in customer experience.
What Do Call Center Statistics Reveal About the Industry?
The call center industry continues to grow at an impressive pace, fueled by rising call volumes, higher expectations for personalization, and emerging AI technologies.
- Call Volume: The average call center handles roughly 4,400 calls each month.
- Customer Preferences: Despite the rise of digital tools, customers still prefer to speak to a live agent, even for non-urgent issues.
- Post-Pandemic Surge: 61% of call center leaders report an increase in call volume since 2020.
- Personalization: 71% of consumers expect personalized interactions, and 76% get frustrated when they don’t receive them.
- Generational Differences: 75% of Gen Z customers prefer self-service options compared to just 19% of Baby Boomers. However, 71% of Gen Z still views live calls as the fastest way to resolve issues.
- CX as a Top Priority: 86% of contact centers have identified improving customer experience as their leading business goal.
What are the Most Important Call Center KPIs?
Tracking the right KPIs gives leaders a clear picture of performance and the customer experience. Below are the key metrics every call center should measure to meet their business goals.
First Call Resolution (FCR)
FCR measures how often a customer’s issue is resolved during the first call. It is one of the strongest indicators of satisfaction and efficiency. High FCR rates mean fewer repeat calls, happier customers, and reduced operational costs. World-class call centers aim for 90% resolution on the first call, while the industry benchmark typically hovers around 70–79%.
Average Handle Time (AHT)
AHT measures the total time an agent spends per interaction, including talk and follow-up time. The goal is balance. Too long may indicate inefficiency, while too short could suggest rushed service. Successful centers monitor AHT alongside customer satisfaction (CSAT) to ensure speed does not come at the cost of quality.
Customer Satisfaction (CSAT)
CSAT measures how satisfied customers feel after interacting with your team. The average U.S. CSAT score is around 73%, and is one of the most widely used KPIs for call center performance. Post-call surveys are a common way to collect this feedback. High CSAT scores are directly linked to customer loyalty, retention, and brand reputation, which makes this one of the most critical metrics to track.
Call Abandonment Rate
Call abandonment rate measures how often customers hang up before reaching an agent. High abandonment rates can signal that customers are experiencing long queues, confusing IVR menus, or frustration with repeated transfers. Industry leaders aim to keep this number below 5%. If your rate is consistently higher, it’s often a sign that your workforce scheduling, routing, or self-service options need improvement.
Average Speed of Answer (ASA)
ASA measures how quickly agents pick up incoming calls. It’s a direct reflection of responsiveness and overall customer experience. The industry benchmark is to answer 80% of calls within 20 seconds. 77% of customers expect to reach someone right away, and 60% define “immediate” as within 10 minutes, which highlights just how critical this metric is to maintaining satisfaction.
Service Level
Service level measures the percentage of calls answered within a specific time frame. It’s a key metric for understanding how well your call center meets customer demand. Falling short of service level goals can lead to higher abandonment rates and lower satisfaction scores. Tracking this metric alongside ASA helps managers identify performance gaps, adjust staffing strategies, and maintain a consistent customer experience even during peak periods.
How Technology is Transforming Contact Centers
Modern contact centers rely on AI, automation, and cloud-based tools to streamline operations, reduce costs, and deliver faster, more personalized service. The data shows that technology isn’t just improving efficiency; it’s redefining what great customer experiences look like.
The Rise of AI and Automation
AI and automation are transforming how contact centers operate by helping teams deliver faster, smarter, and more personalized service.
- Adoption is accelerating: 50% of businesses already use AI-driven tools such as call center software or knowledge bases, and another 34% plan to adopt them soon.
- Chatbots are becoming standard: By 2025, 80% of companies will use AI-powered chatbots or virtual assistants to manage routine customer interactions.
- Performance is improving: Contact centers using AI see a 14% increase in issues resolved per hour and a 9% reduction in average handling time.
- Investment is growing: The conversational AI market is projected to expand from $17.05 billion in 2024 to $49.8 billion by 2031.
AI doesn’t replace human agents—it supports them. Automating repetitive tasks and surfacing real-time insights allows agents to focus on complex, relationship-driven conversations that build customer loyalty.
Conversational IVR
Advanced interactive voice response (IVR) systems and voice assistants use natural language processing to make customer interactions more intuitive. Instead of navigating complex menu trees, callers can explain their needs in plain language and get directed instantly to the right resource. More than 8.4 billion voice assistants are now in active use worldwide, double the number from 2020. This growth reflects a broader shift toward more conversational, frictionless customer support.
Cloud-Based Contact Centers
Cloud-based platforms make it easier for teams to scale, integrate new tools, and support remote or hybrid work environments. The Contact Center as a Service (CCaaS) market is projected to reach $82.43 billion by 2030, driven by businesses seeking flexibility and real-time insights. Cloud systems give managers instant access to analytics, workforce management tools, and performance data all in one place. This allows teams to make data-backed decisions faster and keep service levels consistent across locations and time zones.
Putting Call Center Statistics into Action
Data only creates value when you know how to use it. The key is to analyze your metrics, identify the underlying causes of inefficiencies, and apply focused strategies that drive measurable results and reinforce quality assurance.
- Compare Your Metrics to Industry Benchmarks: This comparison helps you see where your performance stands and highlights opportunities for improvement. If your metrics fall short of benchmarks, focus on those areas first to make the biggest impact on efficiency and satisfaction.
- Use Data to Find the Root Cause: Once you’ve identified performance gaps, use data to understand why they exist. For instance, a high average handle time may point to a lack of training, outdated scripts, or limited access to internal resources. Analyzing performance trends over time can reveal patterns that guide smarter decisions and prevent recurring issues.
- Implement Targeted Strategies for Improvement: With clear insights in hand, develop specific strategies to close performance gaps. This could include building a centralized knowledge base to shorten handle times, investing in coaching programs to boost agent morale, or using workforce management tools to reduce call abandonment. The goal is to turn raw data into meaningful actions that strengthen operations and customer experience alike.
Ready to Use These Statistics to Your Advantage?
The most successful call centers are the ones that act on their data. Whether you’re aiming to reduce handle times, improve first-call resolution, or create a smoother customer journey, your metrics hold the key.
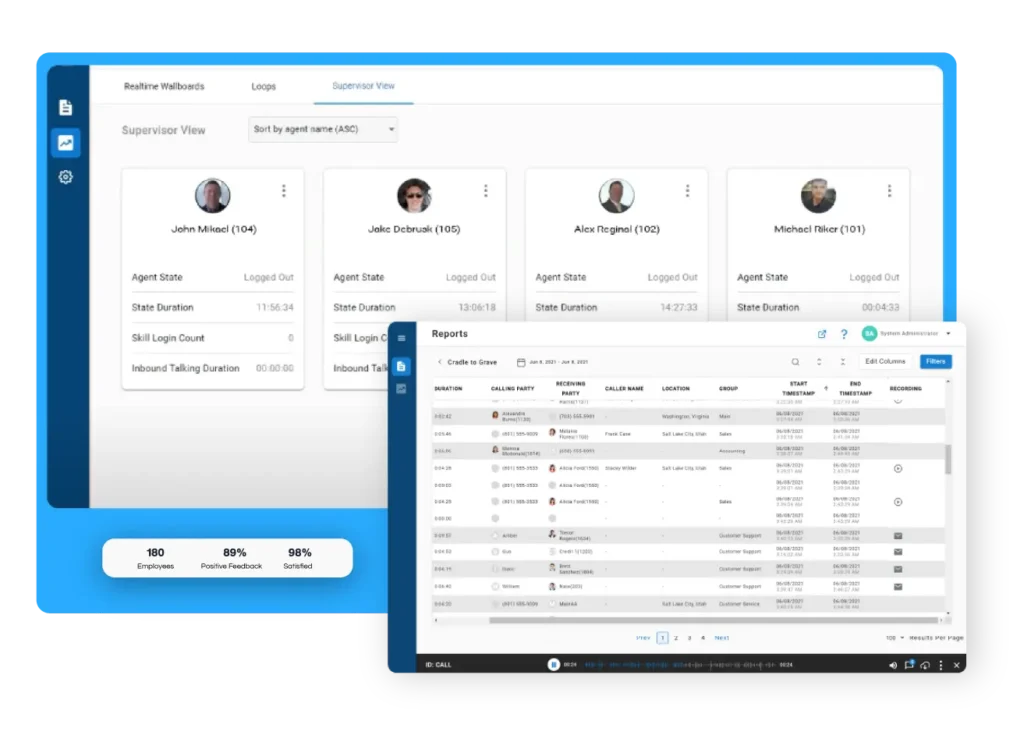
With Xima Software, you can turn call center data into directions. Our analytics and reporting tools reveal the “why” behind your numbers, while intelligent routing and real-time dashboards help teams respond faster and perform better. Request a demo today to see how Xima can help you measure, manage, and improve every customer interaction.
Call Center Statistics FAQs
Tracking call center statistics is important because it helps you measure performance, identify trends, and make data-driven decisions that improve customer experience. Without consistent tracking, it’s nearly impossible to know what’s working and what needs to be improved. Regularly reviewing your data allows you to uncover inefficiencies, optimize training, and ensure that your team continues to meet evolving customer expectations.
A good average handle time (AHT) balances speed with quality. The right number can vary by industry and call complexity, but generally, an AHT that allows agents to resolve issues fully without rushing the customer is ideal. If your AHT is significantly higher than industry averages, it may indicate gaps in training, outdated tools, or inefficient workflows. If it’s too low, agents may be ending calls before issues are fully resolved.
Improving agent productivity starts with equipping your team with the right tools and support. Automated call routing, AI-assisted insights, and unified dashboards help agents access information faster and reduce idle time. Regular coaching, performance feedback, and recognition programs also play a key role in keeping teams engaged and motivated.