Why Real-Time Data is a Game-Changer for Call Center Management
In the fast-paced world of a contact center, decisions can’t wait for a weekly report. While historical reports are valuable for trend analysis and strategic planning, the ability to see what’s happening right now is what separates a reactive team from a proactive one. This is where real-time monitoring comes in.
The central question for every leader is, “How do I monitor real-time call center performance?” The answer lies in focusing on the right data. Real-time monitoring isn’t about being “big brother”; it’s about having the visibility to support agents, optimize resources, and consistently elevate the customer experience (CX)—the overall perception a customer has of your brand.
With the right tools, you can turn a stream of data into decisive action. Choosing metrics that are actionable and timely is the foundation of success[1]. Let’s dive into the five most critical real-time metrics that every call center manager should have on their screen.
Metric #1: How Many Customers Are in Queue? (Calls Waiting)
What It Is
Calls Waiting is the number of customers currently in line, waiting to speak with an agent. It is the most direct snapshot of immediate customer demand versus your team’s current capacity.
Why It Matters in Real-Time
A high number of calls in the queue is a flashing red light for your operation. The risk of ignoring this metric is severe; it directly fuels customer frustration and leads to lost business.
Immediate Insight: A sudden spike in waiting calls is an instant warning sign of potential issues like unexpected call volume, technical glitches, or understaffing.
Customer Frustration: No one likes to wait. Long queues are a primary driver of low Customer Satisfaction (CSAT) scores and a high-effort experience for your customers.
Resource Allocation: This metric tells you if you need to pull agents from other tasks (like email queues or outbound campaigns) to handle the immediate inbound demand.
Actionable Advice
Set clear thresholds for acceptable queue sizes based on your team’s goals and display them on Xima’s Realtime Wallboards. Use color-coded visual alerts to notify the entire floor when the number is breached.
When queues start to grow, use supervisor features like Join Call or Whisper to help newer agents resolve complex calls faster, freeing them up for the next customer.
Investigate the “why.” Is the queue long because of a marketing campaign, a product issue, or inefficient workflows?
Metric #2: Are You Meeting Your Service Level Goals?
What It Is
Service Level is a core contact center agreement, typically expressed as “X percent of calls answered in Y seconds.” A common industry standard is 80/20, which means the goal is to answer 80% of calls within 20 seconds.
Why It Matters in Real-Time
Service level is the pulse of your contact center’s accessibility. It directly measures how well you are delivering on the promise of timely service.
Performance Benchmark: It’s one of the most widely used indicators of your team’s overall efficiency and responsiveness. A dipping service level is often the first sign of emerging problems.
Staffing Accuracy: Consistently failing to meet your service level is a strong signal that your staffing forecasts don’t align with actual call volume, creating a consistent gap between demand and availability.
Customer Expectation: This metric is a direct reflection of the standard you set for your customers. Failing to meet it means you are not meeting their expectations for accessibility.
Actionable Advice
Display your real-time service level on a prominent call center dashboard. This keeps the entire team aligned on a shared, critical goal.
If your service level drops, investigate immediately. Is it due to a sudden spike in volume, an increase in call complexity, or agents being unexpectedly unavailable?
While crucial, be wary of focusing on service level at the expense of quality. Rushing agents can lead to poor resolutions and repeat calls, which ultimately hurts the customer experience.
Metric #3: How Many Customers Are Hanging Up? (Abandonment Rate)
What It Is
Abandonment Rate is the percentage of callers who hang up before they ever connect with an agent. It’s a direct measure of customer impatience and friction in your queuing process.
Why It Matters in Real-Time
Every abandoned call represents a failure to connect. It’s a missed opportunity to solve a problem, make a sale, or build customer loyalty.
Lost Opportunity: High abandonment is a clear sign that your wait times are unacceptable to your customers. These are unresolved issues that can escalate or result in customer churn[2].
Direct Link to Wait Times: Abandonment rate is almost always a direct consequence of a high number of calls waiting and a poor service level. The three metrics are intrinsically linked.
Diagnostic Tool: A sudden spike in abandonment, especially if wait times are low, can indicate a technical problem. Is your Interactive Voice Response (IVR) system confusing? Is there an issue with call routing?
Actionable Advice
If your abandonment rate climbs, give customers a better option. Implementing a queue callback feature, like that offered by Xima Software, allows customers to hang up, keep their place in line, and receive a call from an agent when it’s their turn.
Track abandonment rate by individual queue. This can help you pinpoint if a specific department or call type is creating more friction than others.
Analyze call patterns during abandonment spikes to see if they correlate with specific marketing campaigns, website issues, or service outages.
Metric #4: How Efficiently Are Calls Being Handled? (Average Handle Time)
What It Is
Average Handle Time (AHT) is the average duration of a customer interaction. It’s a comprehensive metric that includes not only talk time but also any hold time and after-call work (ACW) an agent performs to complete the interaction.
Why It Matters in Real-Time
AHT is a powerful indicator of operational efficiency, but it must be managed with care. The goal isn’t just to make it as low as possible; it’s to make it as efficient as possible without sacrificing quality.
Efficiency Metric: A rising AHT across the team can signal that agents are struggling with new processes, lack the right information, or need additional training.
Impact on Queues: Longer handle times mean agents are occupied longer, which directly reduces their availability and negatively impacts service levels and calls waiting.
Cost Management: AHT is a fundamental component of your cost per interaction. Even small, sustainable reductions in AHT can drive significant ROI by increasing overall capacity.
Actionable Advice
Avoid treating AHT as a disciplinary tool. The risk is that agents will rush to end calls, leading to unresolved issues and low CSAT. Instead, use it to identify coaching opportunities.
Use real-time monitoring tools to listen in on calls with unusually high handle times. This helps you understand the root cause—is it a complex issue, a difficult customer, or an agent who needs help?
Empower agents with the tools to be efficient. A seamless CRM integration that puts customer history at their fingertips can drastically reduce lookup times and shorten AHT.
Metric #5: Who is Ready to Help? (Agent Status/Availability)
What It Is
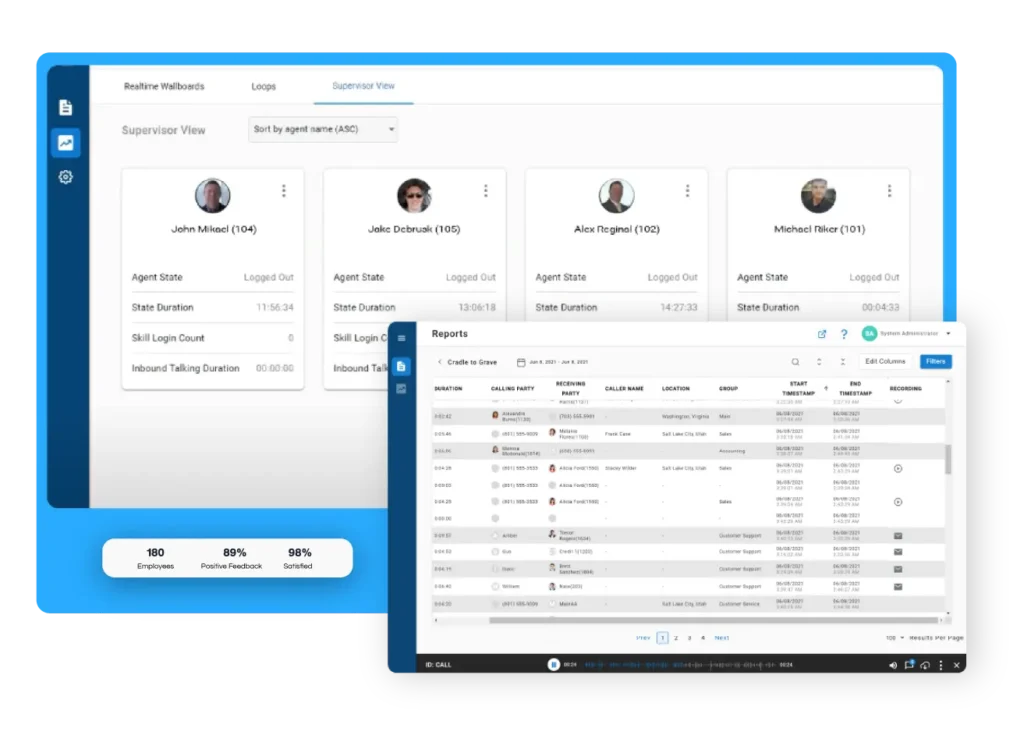
Agent Status provides a real-time view of what every single agent is doing at any given moment. Common statuses include On a Call, Available, In After-Call Work, On Break, or In Training.
Why It Matters in Real-Time
This metric is the “why” behind all the others. It provides the essential context needed to understand your contact center’s performance.
Context for Performance: If your service level is plummeting and queues are high, a quick look at agent statuses might reveal that too many agents are stuck in after-call work or went on break simultaneously.
Schedule Adherence: It allows managers to ensure that agents are following their schedules, which is critical for accurate staffing and forecasting.
Load Balancing: This view helps you see which agents are available to take the next call, ensuring that work is distributed evenly and no single agent becomes overwhelmed.
Actionable Advice
Use a dashboard that provides a clear, color-coded view of every agent’s status for at-a-glance understanding.
Be supportive, not punitive. If an agent has been in “After-Call Work” for an extended period, check in with them. They may need help with a complex case note or simply forgot to change their status.
Use this view to make quick, informed decisions. If queues are suddenly exploding, you can see which agents are on break and politely ask them to return a few minutes early to help manage the rush.
How to Turn Metrics into Action with the Right Tools
Collecting these metrics is only half the battle. If the data isn’t presented in a way that’s easy to understand and act upon, it’s just noise. This is where a powerful platform like Xima Software transforms how you monitor real-time call center performance.
Tools like Xima’s Realtime Wallboards and Call Center Dashboards are designed to bring these five critical metrics—and many more—to life. They provide a centralized, at-a-glance view of your entire operation, empowering you to:
Customize displays to show the specific metrics that matter most to your team and your business goals.
Create automated alerts that notify managers the moment a key threshold is breached, allowing for immediate intervention.
Maintain real-time visibility across physical, remote, and hybrid teams, ensuring everyone is aligned.
Seamlessly move from real-time monitoring to historical trend analysis with comprehensive analytics.
From Data Overload to Data-Driven Decisions
You don’t have to drown in data to run an effective contact center. The key is focusing on the right metrics and using a platform that makes the information clear, contextual, and actionable.
By closely monitoring Calls Waiting, Service Level, Abandonment Rate, Average Handle Time, and Agent Status, you gain a holistic, real-time understanding of your operation. This visibility is the bridge between reacting to yesterday’s problems and proactively shaping positive outcomes for your customers, your agents, and your business today.
Ready to gain real-time control and transform your call center performance? See how Xima provides the actionable insights you need.