Call centers generate vast amounts of data every day. From call volume to agent performance, this information can quickly become overwhelming without the right tools. A call center dashboard serves as the central, visual platform that brings all this data together. By displaying real-time and historical metrics in a single view, dashboards help teams make informed decisions, improve efficiency, and enhance the customer experience.
In this guide, we will explain what a call center dashboard is, the essential metrics to track, and how to use this data to analyze trends and optimize operations.
Key Takeaways
A call center dashboard provides a centralized view of all key metrics, helping teams monitor performance and respond quickly to issues.
Tracking metrics like call volume, customer satisfaction, and agent performance ensures your team meets both efficiency and quality goals.
Using a dashboard to analyze trends allows managers to make data-driven decisions and plan strategically for long-term success.
What is a Call Center Dashboard?
A call center dashboard is a centralized interface that visualizes both live and historical performance metrics. It displays key information such as the number of calls, wait times, and customer satisfaction scores. Dashboards provide at-a-glance insights into the overall health of a call center, enabling teams and managers to quickly react to issues and make informed decisions.
In physical call centers, dashboards are often displayed on screens visible to the entire team. For remote and hybrid teams, dashboards provide the same level of visibility, ensuring everyone stays informed and aligned on key performance objectives. By centralizing this data, dashboards also motivate teams to meet goals and improve overall performance.
Metrics to Track on a Call Center Dashboard
Monitoring the right metrics is critical to understanding both the efficiency and effectiveness of your call center. Below are the key categories and metrics to include.
Call Traffic & Handling Metrics:
These metrics provide a baseline understanding of call center activity and demand. They are essential for managing resources and ensuring customer needs are met in real time.
- Total Calls: Tracks the number of incoming calls within a specific period. This metric helps measure overall demand.
- Answered Calls: Indicates the calls successfully handled by agents, providing insight into productivity and capacity.
- Abandoned Calls: Measures the number of calls where the customer hangs up before speaking with an agent. High numbers may indicate understaffing or long wait times.
Performance Metrics
Performance metrics measure how efficiently agents handle calls and directly impact productivity.
- Average Handle Time (AHT): The average duration of each call, including talk and after-call work. Lower AHT often reflects efficient call handling.
- First Call Resolution (FCR): Percentage of calls resolved on the first contact, indicating service effectiveness and customer satisfaction.
- Average Speed of Answer (ASA): Measures how quickly calls are answered. Faster response times can improve customer experience.
- Agent Occupancy: Shows how much time agents spend actively handling calls versus idle or in breaks. This helps optimize staffing and workflows.
Customer Satisfaction Metrics
Customer satisfaction metrics measure the quality of service and overall experience.
- Customer Satisfaction Score (CSAT): Average rating from customer surveys or feedback forms after interactions.
- Net Promoter Score (NPS): Likelihood that customers would recommend your service to others.
- Customer Effort Score (CES): Measures how easy it was for a customer to resolve their issue. Lower effort scores generally indicate better service.
Agent Performance Metrics
Tracking agent-specific metrics ensures proper staffing and prevents burnout while maintaining service levels.
- Agent Availability: Shows which agents are logged in, on calls, or idle.
- Average Handle Time: Helps identify areas for training or coaching.
- First Contact Resolution: Measures each agent’s effectiveness at solving issues on the first attempt.
- Agent Satisfaction: Gauges employee engagement and helps optimize workforce efficiency.
For more on evaluating and managing agent performance, see Xima Scorecards and Evaluations and Workforce Management.
Types of Call Center Dashboards
Dashboards can be tailored to different purposes and audiences.
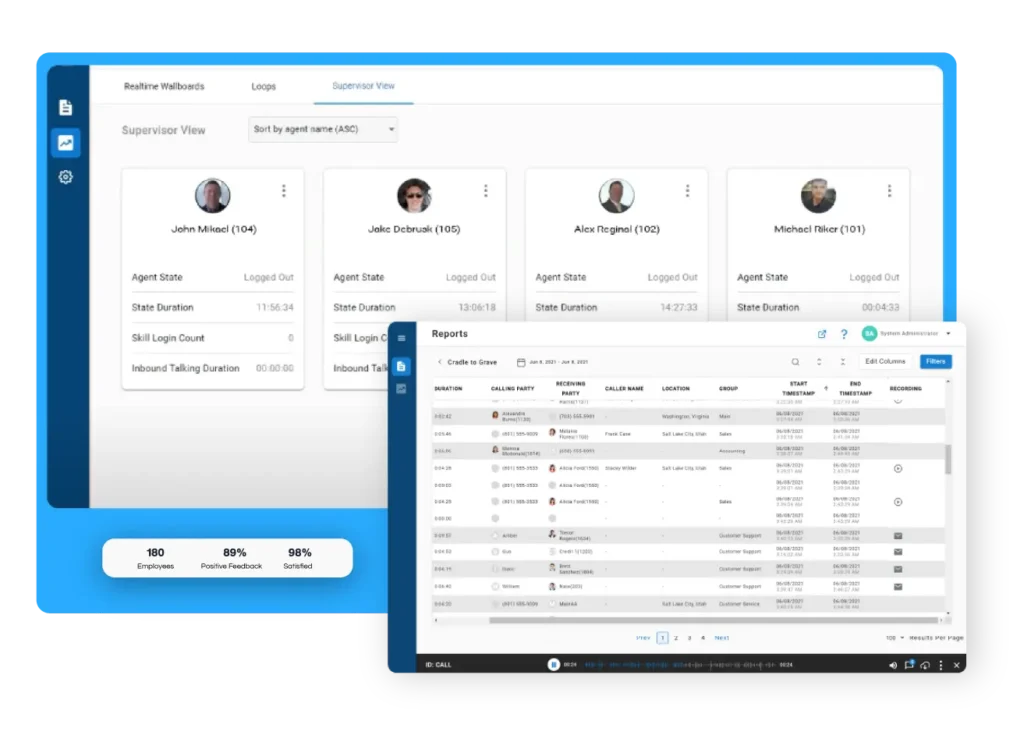
Live/Real-Time Dashboards
Real-time dashboards display data as it happens, allowing supervisors to monitor queues, agent status, and service levels. They are critical for making immediate adjustments and improving operational efficiency.
Common metrics on live dashboards include:
- Total calls today
- Average wait time
- Percent of calls resolved
- Abandonment rate
- Best-performing agents
- Current agent states
Learn more about real-time dashboards with Xima Real-Time Wallboards.
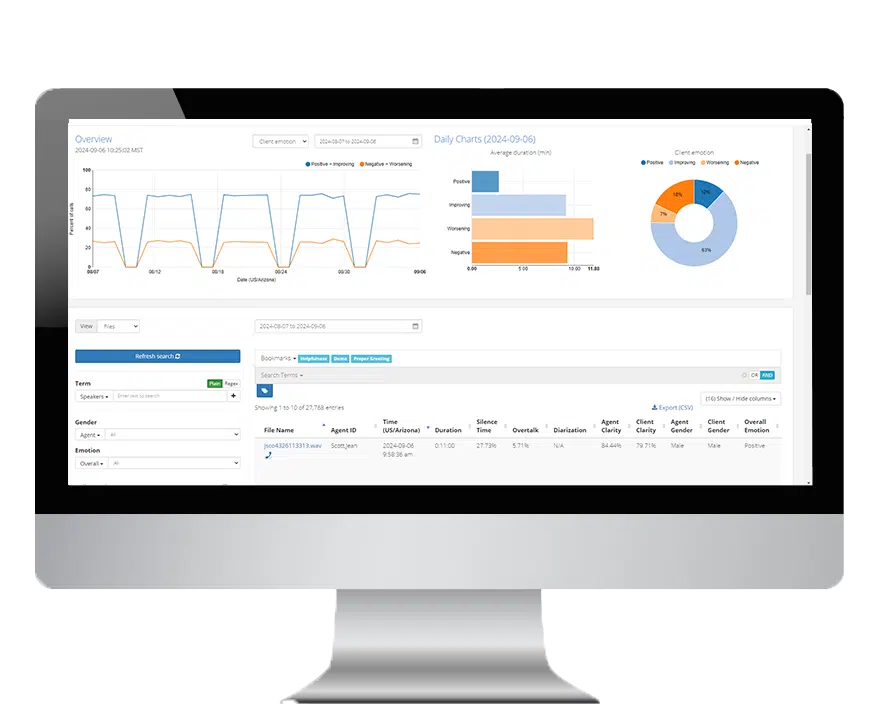
Historical/Analytical Dashboards (Call Center KPIs)
These dashboards focus on past performance to identify long-term trends and patterns. Managers and analysts use them for strategic planning, reporting, and resource allocation.
Typical historical metrics include:
- First-call resolution rate
- Daily and monthly call comparisons
- CSAT trends
- Call resolution trends
- Average handle time
- Average time on hold
Omnichannel Dashboards
Omnichannel dashboards unify data from multiple channels, including phone, email, chat, and social media. They provide a complete view of the customer journey and help teams optimize performance across all touchpoints.
For unified reporting and insights, see Xima Reporting and Analytics.
How to Analyze Trends with Call Center Dashboards
Analyzing trends starts by identifying patterns in the data. Look for recurring spikes or dips in key metrics, such as higher call volume on Mondays or lower FCR on certain shifts. Dashboards like Xima’s allow filtering by date, agent, or channel, making it easy to pinpoint trends and take action.
For example, if Average Handle Time increases on certain days, you may need to allocate additional agents or provide extra training. Monitoring trends over time helps predict staffing needs, improve service quality, and reduce customer churn.
What to Look For When Choosing the Right Dashboard Solution
When selecting a call center dashboard platform, consider the following criteria:
- Real-Time Data: Ensures you can respond immediately to issues.
- Customization Options: Allows you to focus on metrics that matter most to your business.
- Ease of Use: Simple interfaces reduce the learning curve and increase adoption.
- Integration Capabilities: Connects with your CRM, ticketing system, and other tools for holistic insights.
Xima dashboards meet these criteria, offering customizable, intuitive views with real-time and historical reporting. Learn more at Xima Reports and Xima Analytics.
Transform Your Call Center with a Powerful Dashboard like Xima
A call center dashboard is essential for managing operations, tracking performance, and improving customer satisfaction. By monitoring the right metrics and analyzing trends, you can make informed, data-driven decisions that drive efficiency and service quality.
See how Xima can transform your call center operations with a free demo.
FAQs About Call Center Dashboards
- What’s the difference between a call center dashboard and a wallboard?
- A dashboard is a personalized, interactive tool on a computer for users to explore metrics in depth. A wallboard is a large, public-facing display for team-wide, at-a-glance visibility of key metrics like queue status and agent availability.
- What is a KPI dashboard?
- A KPI dashboard visualizes metrics that are directly tied to business goals. A call center dashboard is a specific type of KPI dashboard, focused on customer service performance.
- What are the call center metrics I should focus on?
- Start with foundational metrics that align with your goals. For efficiency and satisfaction, track Average Handle Time (AHT) and First Call Resolution (FCR). To understand overall demand, monitor Total Calls and Answered Calls.