
Key Takeaways: Contact Center Reporting for SMB Teams in 2026
- Contact center reporting turns raw call data into actionable insights that help you reduce abandonment, improve first-call resolution, and coach agents effectively.
- Real-time dashboards and historical reports serve different purposes—you need both to manage daily operations and spot long-term trends.
- Xima Software gives SMB teams cradle-to-grave reporting that tracks every interaction from queue entry to wrap-up, closing visibility gaps that plague manual review.
- The metrics that matter most for SMBs include average handle time, call abandonment rate, first-call resolution, and service level—each tied directly to customer experience.
- AI-powered analytics now make it possible to score 100% of interactions automatically, replacing the guesswork of reviewing 1-3% of calls manually.
What Is Contact Center Reporting and Why Does It Matter for SMBs?
Somewhere in your contact center right now, an agent is on a call. Maybe they’re processing a payment, handling a complaint, or answering a question about your product. When that call ends, what happens to the data?
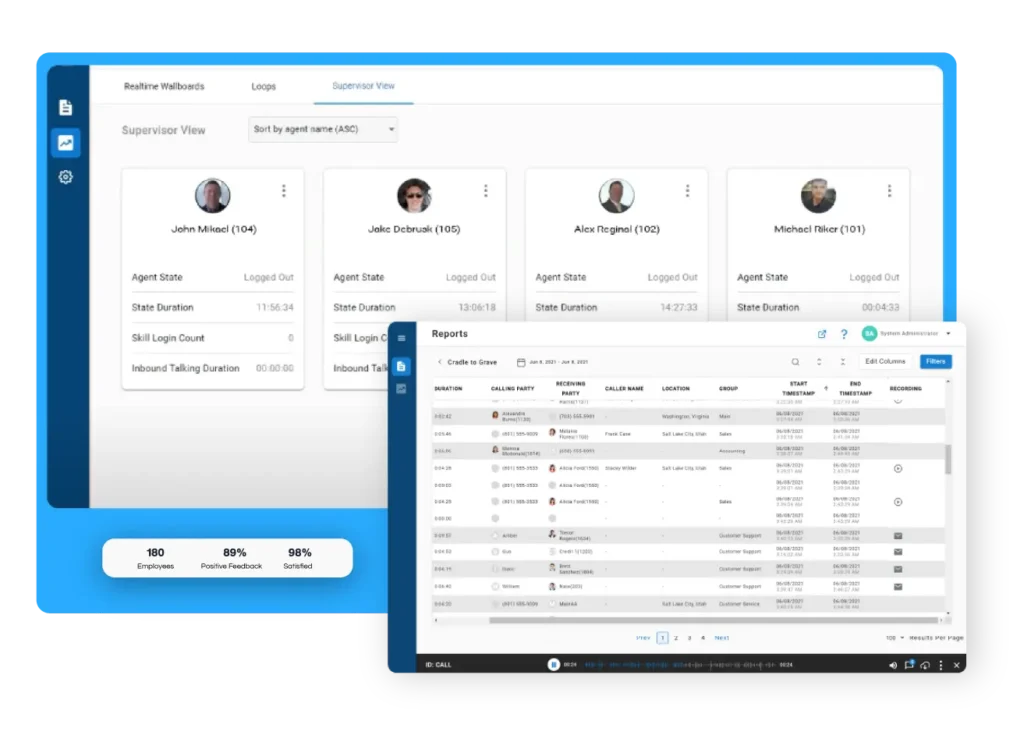
Xima’s contact center reporting covers the metrics discussed in this guide.
Contact center reporting is the system that captures, organizes, and presents the operational data flowing through your contact center every hour. It’s how you know whether your team is hitting service level targets, where calls are getting stuck, and which agents need coaching.
For SMB teams, reporting isn’t a nice-to-have. It’s the difference between managing your operation and guessing at it. Without real visibility into what’s happening on the phones, you’re making staffing decisions, process changes, and performance evaluations based on incomplete information.
The Blind Spot Problem in SMB Contact Centers
Here’s the structural reality most SMB contact center managers face: you’re capturing data, but you’re not seeing it. Calls get recorded. Metrics get logged somewhere. But the information lives in disconnected systems, manual spreadsheets, or reports that take days to pull.
That blind spot has real costs. Missed patterns in call volume. Agents struggling without feedback. Customer complaints that repeat because nobody connected the dots. The data exists—it’s just invisible when you need it.
What Types of Reports Should SMB Contact Centers Track?
Not all reports serve the same purpose. Before you start building dashboards, you need to understand the categories of reporting that drive different decisions in your operation.
Real-Time Reports and Wallboards
Real-time reporting shows you what’s happening right now. How many calls are in queue? Which agents are available? What’s the current wait time? These metrics change by the minute, and supervisors need them visible at all times to make staffing adjustments on the fly.
Wallboards display these real-time metrics on screens visible to the entire team. When agents can see queue depth and service level, they adjust their pace naturally. When supervisors spot a spike forming, they can pull agents from other tasks before abandonment climbs.
Historical Reports for Trend Analysis
Historical reports aggregate data over time—daily, weekly, monthly, or custom date ranges. These reports reveal patterns you can’t see in real-time: seasonal call volume shifts, day-of-week trends, the impact of a process change you made three months ago.
For SMB teams, historical reports drive decisions like hiring, scheduling, and budget allocation. If you can show that call volume spikes 40% every Monday morning, you can staff accordingly instead of scrambling.
Cradle-to-Grave Interaction Reports
Cradle-to-grave reporting tracks a single interaction from the moment it enters your system until it’s fully resolved. This includes queue time, transfers between agents, hold periods, and wrap-up activities. Xima Software captures this complete lifecycle in one view, so you’re not piecing together fragments from multiple systems.
This level of detail matters when you’re troubleshooting complaints or auditing specific interactions. Instead of guessing which agent handled a call or how long the customer waited, you have the full picture documented.
Which Contact Center Metrics Should SMB Teams Prioritize?
You could track hundreds of metrics. Most SMB teams shouldn’t. Focus on the numbers that directly connect to customer experience and operational efficiency—the ones that tell you whether things are getting better or worse.
Average Handle Time (AHT)
Average handle time measures the total duration of a customer interaction, including talk time, hold time, and after-call work. It’s one of the most-watched metrics in contact centers because it directly affects how many calls your team can handle.
But AHT alone doesn’t tell the whole story. A short handle time means nothing if the customer has to call back tomorrow. Track AHT alongside first-call resolution to get the complete picture.
Call Abandonment Rate
Call abandonment rate tracks how many callers hang up before reaching an agent. High abandonment usually signals one of two problems: wait times are too long, or your IVR is frustrating callers into giving up.
For SMB teams, abandonment is a direct measure of lost opportunity. Every abandoned call is a customer who didn’t get help—and may not call back. A study by HDI found that the industry-standard benchmark for abandonment is around 5-8%, though this varies by industry and call type.
First-Call Resolution (FCR)
First-call resolution measures the percentage of calls resolved without requiring a callback or transfer. High FCR means customers get answers the first time. Low FCR means your team is creating repeat work—and frustrated customers.
Improving FCR often requires better agent training, smarter routing, and access to information during the call. It’s also one of the clearest indicators of whether your contact center is actually helping people or just processing volume.
Service Level
Service level is typically expressed as a percentage of calls answered within a target time—for example, 80% of calls answered within 20 seconds. This metric balances customer wait time against staffing costs.
Your target service level depends on your business and customer expectations. A medical office might aim for 90% in 15 seconds. A retail support line might accept 70% in 45 seconds. The key is setting a realistic target and tracking consistently.
How Does Interaction Tracking Work in Modern Contact Centers?
Interaction tracking captures the details of every customer touchpoint across all channels—voice, chat, email, SMS. For SMB teams managing multiple communication methods, this creates a unified record of each customer’s journey.
Why Multi-Channel Tracking Matters
Your customers don’t think in channels. They call, then email, then chat—and expect you to know they’re the same person with the same issue. Without unified interaction tracking, every conversation starts from scratch.
Xima CCaaS brings voice, chat, email, and SMS into a single platform with unified reporting. That means when a customer calls about an issue they first raised via web chat, your agent has the full context without asking the customer to repeat themselves.
Call Recording vs. Interaction Documentation
Recording calls is not the same as documenting interactions. Recording creates raw audio files. Documentation means capturing metadata, outcomes, agent notes, and the complete lifecycle of the conversation.
Here’s the distinction that matters: a recording tells you what was said. Interaction documentation tells you what happened, how long it took, where the call was routed, and how it was resolved. You need both, but documentation drives reporting.
What Is Performance Monitoring in Contact Centers?
Performance monitoring tracks how individual agents and teams are performing against defined targets. It’s the foundation of coaching, accountability, and continuous improvement in contact center operations.
Agent-Level Performance Metrics
At the agent level, you’re tracking metrics like calls handled, average handle time, after-call work duration, adherence to schedule, and quality scores. These numbers reveal who’s performing well, who needs coaching, and where process issues might be hiding.
The goal isn’t surveillance—it’s visibility. When you can see that one agent consistently has longer handle times, you can investigate whether they need training, better tools, or if they’re actually spending extra time to resolve issues completely.
Team and Queue Performance
Team-level monitoring aggregates individual metrics into a picture of how groups are performing. Which queues have the longest wait times? Which teams hit their service level targets? Where are calls getting stuck?
Queue-level reporting helps you identify routing problems, skill gaps, and capacity issues. If your technical support queue is backed up while general inquiries runs smoothly, that tells you where to focus staffing or training resources.
Quality Assurance and Call Scoring
Quality assurance goes beyond speed metrics to evaluate whether interactions meet your standards. Traditional QA involves supervisors manually reviewing a sample of calls and scoring them against a rubric.
The problem with manual QA? You’re reviewing 1-3% of calls at most. The other 97% is a blind spot. AI-powered QA—like the Auto QA feature in Xima CCaaS—scores 100% of interactions automatically, flagging issues that would otherwise go unnoticed.
How Do Real-Time Dashboards and Wallboards Improve Contact Center Operations?
Real-time dashboards and wallboards aren’t just nice displays—they’re operational tools that change how supervisors and agents work throughout the day.
Supervisor Dashboards for Immediate Decision-Making
A supervisor dashboard consolidates the metrics you need to manage your operation in real time. Queue depth, longest wait, agent status, service level—all visible at a glance. When something goes wrong, you see it immediately instead of discovering it in tomorrow’s report.
Effective supervisor dashboards are customizable. Different teams have different priorities. A healthcare contact center might emphasize patient wait times and compliance alerts. A retail center might focus on conversion metrics and seasonal queue patterns.
Agent Wallboards for Team Visibility
Wallboards display key metrics on screens visible to the entire contact center floor. They serve two purposes: keeping agents aware of current conditions and creating gentle accountability through transparency.
When the team can see that the queue is building, they naturally adjust. Breaks get shorter. Wrap-up times tighten. It’s not about pressure—it’s about shared awareness of what’s happening right now.
Alerting and Threshold Notifications
Modern dashboards include alerting capabilities that notify supervisors when metrics cross defined thresholds. Wait time exceeds 90 seconds? Get an alert. Abandonment rate spikes above 10%? Get an alert.
These alerts let supervisors focus on other work until something needs attention. Instead of watching metrics constantly, they can trust the system to flag problems as they develop.
What Should SMB Teams Look for in Contact Center Reporting Tools?
Not all reporting tools are built for SMB operations. Enterprise platforms often come with complexity and cost that smaller teams don’t need. Here’s what to prioritize when evaluating your options.
Ease of Use and Setup Time
If your reporting tool requires weeks of implementation and a dedicated admin to maintain, it’s probably not built for SMB teams. You need something your supervisors can configure without IT involvement.
Xima Software focuses on usability precisely because SMB teams don’t have time for steep learning curves. The interface is designed for non-technical staff to create reports, build dashboards, and pull data without specialized training.
Customizable Reports and Dashboards
Pre-built reports are helpful, but every operation is different. You need the ability to create custom reports that track the specific metrics your business cares about, filtered by the dimensions that matter to your workflow.
Look for drag-and-drop report builders, flexible date ranges, and the ability to save and schedule reports. If pulling a simple report requires a support ticket, you’ll stop using the tool.
Integration with Your Existing Systems
Your contact center doesn’t exist in isolation. Reporting tools need to connect with your CRM, your phone system, and your business applications to create a complete picture of customer interactions.
Xima Software offers native integrations with popular CRMs, Microsoft Teams, and over 70 EHR systems for healthcare operations. These aren’t shallow connections—they’re bi-directional integrations that sync data both ways.
Transparent Pricing Without Surprises
Ask any contact center vendor about pricing and you’ll often get a range of tiers, add-ons, and usage-based fees that make the actual cost unclear. SMB teams need predictable costs they can budget around.
Look for vendors with transparent, all-in pricing that includes implementation, support, and the features you need. Ask specifically about what’s included versus what costs extra.
How Can AI Improve Contact Center Reporting and Analytics?
AI is changing what’s possible in contact center reporting—not by replacing human judgment, but by processing volumes of data that humans simply can’t review manually.
AI-Powered Speech Analytics
Speech analytics uses AI to transcribe calls and analyze the content for keywords, sentiment, and compliance markers. Instead of supervisors listening to random call samples, AI can scan every call for specific phrases, escalation triggers, or script adherence.
This capability surfaces patterns that would otherwise stay hidden. You might discover that calls mentioning a specific product have 3x the escalation rate—information that’s invisible without analyzing call content at scale.
Automated Quality Assurance Scoring
Traditional QA is limited by supervisor time. If a supervisor can review 20 calls a day and your center handles 1,200 calls, you’re sampling less than 2% of interactions. The other 98%? Unknown territory.
AI-powered Auto QA scores every interaction against your defined criteria automatically. This isn’t replacing human QA—it’s giving supervisors a pre-filtered view of which calls need attention so they can focus their limited time on what matters.
Sentiment Analysis and Real-Time Alerts
Sentiment analysis detects the emotional tone of interactions in real time. When a call is going poorly, the system can alert a supervisor before the customer hangs up frustrated or demands to escalate.
For SMB teams, this means catching problems as they happen instead of discovering them in a survey response days later. Real-time sentiment alerts give supervisors the chance to intervene when it can still make a difference.
How Do You Build a Contact Center Reporting Strategy for Your SMB?
Having reporting tools isn’t the same as having a reporting strategy. You need a structured approach to which metrics you track, how often you review them, and what actions you take based on the data.
Step 1: Define Your Key Performance Indicators
Start by identifying the 5-7 metrics that directly tie to your business goals. For most SMB contact centers, this includes service level, abandonment rate, first-call resolution, average handle time, and customer satisfaction scores.
Resist the urge to track everything. Too many metrics creates noise that obscures the signals that matter. Focus on the numbers that drive decisions.
Step 2: Establish Baselines and Targets
Before you can improve, you need to know where you’re starting. Pull historical data to establish baselines for each KPI. Then set realistic targets based on industry benchmarks and your operational constraints.
Document these baselines. Three months from now, you’ll want to see whether your changes are making a difference.
Step 3: Create a Reporting Cadence
Different reports serve different purposes and need different review frequencies. Real-time dashboards get checked throughout the day. Daily reports review yesterday’s performance. Weekly and monthly reports look at trends.
Build a calendar: daily standup reviews, weekly supervisor meetings, monthly business reviews. Each meeting should have specific reports attached and specific decisions on the agenda.
Step 4: Assign Accountability for Metrics
Every metric needs an owner. Someone who’s responsible for watching that number, investigating when it moves, and proposing actions when it trends the wrong direction.
Without clear ownership, reports get generated but nothing changes. Accountability turns data into action.
Step 5: Build Feedback Loops
Reporting is only valuable if it drives improvement. Create structured processes for turning data insights into operational changes—and then measuring whether those changes worked.
Monthly review: What did the data tell us? What did we change? What was the impact? This feedback loop is where reporting delivers actual ROI.
What Are Common Contact Center Reporting Mistakes SMB Teams Should Avoid?
Even with good tools and intentions, SMB teams often fall into patterns that undermine their reporting efforts. Here’s what to watch for.
Tracking Too Many Metrics
More data isn’t always better. When supervisors face dashboards with 30 metrics, they stop looking at any of them. Focus on the vital few that drive your business outcomes.
If you can’t explain why a metric matters and what you’d do differently based on its value, you probably don’t need to track it.
Ignoring Data Quality Issues
Reports are only as good as the data feeding them. If agents aren’t coding calls correctly, if transfers break your tracking, if system integrations are lagging—your reports will mislead you.
Audit your data sources regularly. Spot-check reports against reality. When something looks wrong, investigate before making decisions.
Reviewing Reports Without Taking Action
The most common reporting failure isn’t bad data—it’s good data that nobody acts on. Reports get generated, reviewed in meetings, and filed away without changing anything.
Every report review should end with specific action items. If you’re reviewing data but never changing behavior based on what you see, you’re wasting the effort.
How Does Xima Software Help SMB Teams with Contact Center Reporting?
Xima Software builds contact center tools specifically for the challenges SMB teams face—powerful capabilities without enterprise complexity or cost.
Cradle-to-Grave Visibility
Xima’s cradle-to-grave reporting captures every moment of an interaction from queue entry to wrap-up. No more piecing together fragments from multiple systems. No more blind spots where data disappears during transfers.
When a customer calls to complain about their experience, you can pull up the complete record in seconds. Every queue, every hold, every transfer—documented in one view.
Real-Time Wallboards and Scheduled Reports
With Xima CCaaS, supervisors get customizable real-time wallboards that display the metrics that matter to their operation. Historical reports can be scheduled and delivered automatically, so the data arrives when you need it.
Contact center teams using Xima Software have reported improving service levels from 50-70% to over 90%, largely through better visibility into what’s happening on the floor.
AI-Powered Auto QA and Speech Analytics
Xima’s AI capabilities let you score 100% of interactions automatically instead of sampling 1-3%. Speech analytics transcribe and analyze calls for compliance markers, sentiment indicators, and coaching opportunities.
This shifts your QA team from random sampling to targeted review—spending their time on calls that actually need human attention.
User-Friendly Interface Built for Non-Technical Staff
Unlike enterprise platforms that require dedicated admins, Xima is designed for supervisors and managers to use directly. Creating reports, customizing dashboards, and pulling data doesn’t require IT involvement or specialized training.
This accessibility means you’ll actually use your reporting tools instead of letting them collect dust.
In Conclusion: Turning Contact Center Data Into Better Customer Service Decisions
Contact center reporting isn’t about generating more data. It’s about creating visibility into what’s happening in your operation—and using that visibility to make better decisions.
For SMB teams, the challenge isn’t accessing enterprise-grade reporting. It’s finding tools built for your scale, your budget, and your operational reality. Tools that don’t require weeks of implementation or dedicated admin staff. Tools your supervisors will actually use.
The question isn’t whether you need contact center reporting. It’s whether your current approach gives you the visibility to spot problems before they become crises, coach agents before bad habits become permanent, and demonstrate ROI to leadership when budget conversations happen.
Smaller teams can see the full picture on Xima’s contact center solutions for small businesses.
Ready to see what real-time visibility looks like for your SMB contact center? Request a demo from Xima Software and see cradle-to-grave reporting in action.
FAQs About Contact Center Reporting for SMB Teams
What is the difference between real-time and historical contact center reports?
Real-time reports show you what’s happening right now—current queue depth, agent availability, and live service level. Historical reports aggregate data over time periods to reveal trends, patterns, and the impact of changes you’ve made.
You need both. Real-time reports drive immediate decisions. Historical reports inform strategy and resource planning.
How many metrics should an SMB contact center track?
Focus on 5-7 key performance indicators that directly connect to your business outcomes. For most SMB teams, this includes service level, call abandonment rate, first-call resolution, average handle time, and customer satisfaction.
Tracking too many metrics creates noise that obscures the signals that matter. If you can’t explain what you’d do differently based on a metric’s value, you probably don’t need it.
What is cradle-to-grave reporting in contact centers?
Cradle-to-grave reporting tracks an interaction from the moment it enters your system until it’s completely resolved. This includes queue time, agent connections, transfers, holds, and wrap-up activities.
Xima Software captures this complete lifecycle in a single view, eliminating the blind spots that occur when you’re piecing together data from multiple systems.
How does AI improve contact center quality assurance?
Traditional QA relies on supervisors manually reviewing a small sample of calls—typically 1-3%. AI-powered QA scores 100% of interactions automatically against your defined criteria.
Xima Software’s Auto QA feature uses AI to analyze every call, flagging issues that need human attention. This lets your QA team focus on targeted coaching instead of random sampling.
What reporting features should SMB teams prioritize when choosing a contact center platform?
Look for customizable dashboards, scheduled reporting, real-time alerting, and integration with your existing CRM and phone systems. Ease of use matters—if creating a report requires IT support, you won’t use the tool.
Xima Software prioritizes usability for SMB teams, with interfaces designed for non-technical staff to build reports and dashboards independently.
How often should contact center teams review their reports?
Real-time dashboards should be monitored throughout the day. Daily reports review yesterday’s performance in morning standups. Weekly reports drive supervisor meetings. Monthly reports inform business reviews and strategic planning.
The key is building a consistent cadence where specific reports drive specific decisions at defined intervals.
What is the difference between call recording and interaction tracking?
Call recording captures the audio of conversations. Interaction tracking captures the complete metadata—queue times, transfers, hold duration, agent notes, resolution codes, and outcomes.
Recording tells you what was said. Interaction tracking tells you what happened. Effective contact center reporting requires both.