Somewhere in your healthcare contact center today, an agent is on a call with a patient who has questions about a prescription refill. The call takes longer than expected. The patient sounds frustrated. After the interaction ends, that call disappears into your phone system—one of hundreds that day.
Did the agent follow the required verification steps? Was the patient’s concern resolved? You probably don’t know, because nobody reviewed it. This is the blind spot that healthcare contact center reporting is designed to close. And in 2026, the tools available to close it have changed significantly.
Xima Software gives healthcare contact centers the visibility they need to track every patient interaction from start to finish. This guide covers the metrics, dashboards, and compliance-safe analytics that help you measure what matters—and act on what you find.
Key Takeaways: Healthcare Contact Center Reporting in 2026
- Contact center reporting turns raw call data into actionable insights about patient experience and agent performance.
- Healthcare teams must track metrics like first call resolution, average handle time, and call abandonment to improve service levels.
- HIPAA-compliant reporting requires audit trails, role-based access controls, and secure data handling at every step.
- Xima’s cradle-to-grave reporting captures the complete lifecycle of every patient interaction in one view.
- Real-time dashboards and AI-powered analytics help supervisors identify problems before they become patterns.
What Is Contact Center Reporting?
Contact center reporting is the process of collecting, organizing, and analyzing data from customer interactions. For healthcare organizations, this means tracking every phone call, chat, email, and text message that flows through your patient service team.
The goal is simple: turn raw interaction data into insights you can act on. A good reporting system tells you how long patients wait on hold, how often calls get abandoned, and which agents need coaching.
Without reporting, you’re operating blind. You might assume your team is performing well because nobody has complained. But complaints are lagging indicators. By the time a patient files a formal grievance, you’ve already lost their trust.
Why Healthcare Contact Centers Need Specialized Reporting
Healthcare isn’t like retail or financial services. Patient calls often involve protected health information (PHI), which means every report you generate must comply with HIPAA regulations.
You also face unique operational pressures. A patient calling about test results has different expectations than someone asking about their cable bill. The emotional stakes are higher, the information is more sensitive, and the consequences of a bad interaction can affect health outcomes.
Generic contact center reporting tools weren’t built for these realities. You need analytics that account for PHI handling, integrate with electronic health records (EHRs), and support the compliance documentation your organization requires.
Essential Healthcare Call Center Metrics to Track
The metrics you track shape the behaviors you see. Choose the wrong KPIs, and your team will optimize for the wrong outcomes. Here are the metrics that matter most for healthcare contact centers.
First Call Resolution (FCR)
First call resolution measures the percentage of patient calls that get resolved without requiring a callback or transfer. For healthcare contact centers, this is one of the most important metrics you can track.
When a patient calls about an appointment and has to call back three times to get it scheduled, that’s not just an inconvenience. It’s a barrier to care. High FCR rates correlate with higher patient satisfaction scores and lower operational costs.
To calculate FCR, divide the number of calls resolved on first contact by the total number of calls. A rate above 70% is generally considered good for healthcare contact centers, though the benchmark varies by call type.
Average Handle Time (AHT)
Average handle time tracks how long agents spend on each call, including talk time, hold time, and after-call work. In healthcare, this metric requires careful interpretation.
A shorter AHT isn’t always better. If agents rush through calls to hit a time target, they might miss critical information or leave patients feeling unheard. The goal is to find the balance between efficiency and thoroughness.
Track AHT by call type rather than across your entire queue. Billing questions might average four minutes. Appointment scheduling might take six. Medication inquiries might need eight. Setting separate benchmarks for each category gives you more actionable data.
Call Abandonment Rate
Abandonment rate measures the percentage of callers who hang up before reaching an agent. Every abandoned call represents a patient who didn’t get the help they needed.
For healthcare organizations, high abandonment rates can have serious consequences. A patient who abandons a call about medication side effects might delay seeking care. Someone trying to schedule a follow-up appointment might give up entirely.
Industry benchmarks suggest keeping abandonment below 5%. If your rate is higher, the problem is usually wait time. According to research from Centrical’s analysis of contact center KPIs, even small reductions in hold time can significantly reduce abandonment.
Service Level
Service level measures the percentage of calls answered within a target time threshold—typically expressed as “X% of calls answered in Y seconds.” A common target is 80/20: 80% of calls answered within 20 seconds.
This metric matters because it sets patient expectations. If someone calls your healthcare contact center, how long should they expect to wait? Service level gives you a concrete answer and a target to measure against.
Track service level throughout the day, not just as a daily average. A contact center that meets its service level during quiet hours but fails during peak times isn’t actually meeting patient needs.
Patient Satisfaction (PSAT) Scores
Patient satisfaction surveys measure how callers feel about their experience. These scores provide a direct line to patient perception—something you can’t get from operational metrics alone.
Post-call surveys should be short and focused. Ask about the specific interaction rather than general satisfaction. “Did we resolve your issue today?” gives you more actionable data than “How satisfied are you with our organization?”
Compare satisfaction scores against operational metrics to identify patterns. You might find that high FCR doesn’t always correlate with high satisfaction—some complex issues require multiple touches but leave patients feeling well-cared-for.
How to Build Effective Contact Center Dashboards
Metrics only matter if the right people can see them at the right time. That’s where dashboards come in. A well-designed dashboard turns data into decisions.
Real-Time Wallboards for Supervisors
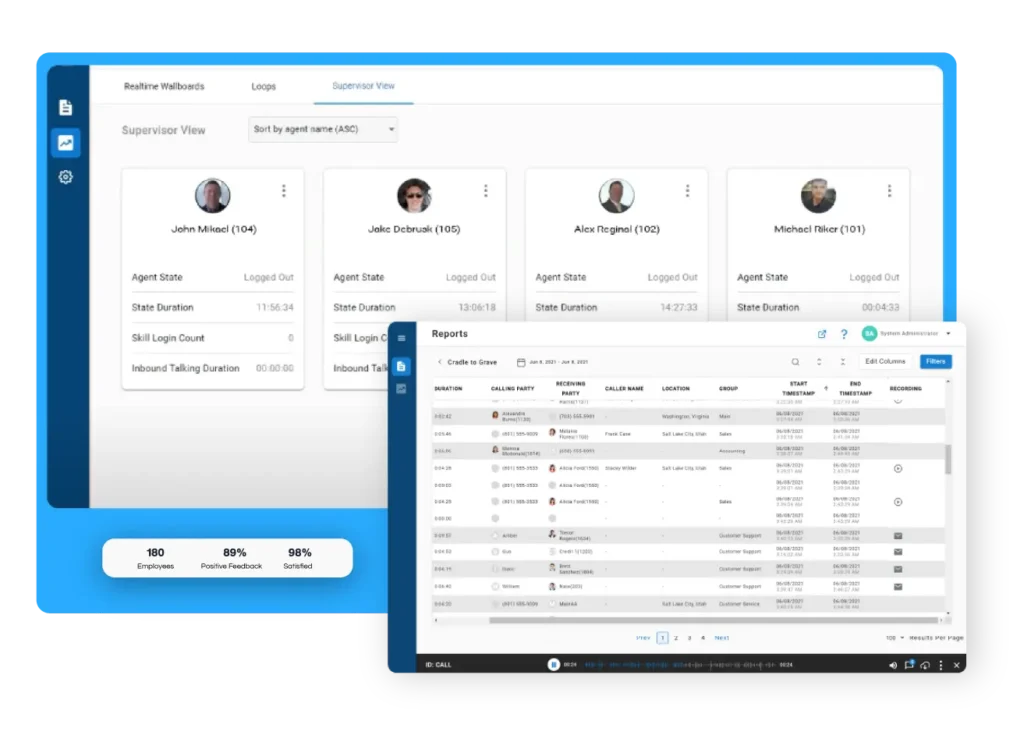
Real-time wallboards display live queue status, agent availability, and current service levels. Supervisors use these dashboards to spot problems as they develop—before they become crises.
Effective wallboards include queue depth, longest wait time, current abandonment rate, and agents available. When any of these metrics goes red, the supervisor knows to take action immediately.
Xima’s real-time wallboards give supervisors instant visibility into contact center performance. The customizable displays highlight the metrics that matter most to your operation, updated in real time as conditions change.
Historical Reports for Trend Analysis
While real-time dashboards help you react to problems, historical reports help you prevent them. These reports show patterns over time—daily, weekly, monthly, and quarterly trends that reveal structural issues.
Look for patterns in your historical data. Does abandonment spike every Monday morning? Do certain agents consistently achieve higher FCR? Are specific call types taking longer than expected? Historical reports surface these insights.
Build reports that answer specific operational questions. “What was our service level last month?” is less useful than “Which hours did we fail to meet service level, and what was happening in the queue at those times?”
Agent Performance Scorecards
Agent-level reporting tracks individual performance across key metrics. These scorecards help supervisors identify coaching opportunities and recognize top performers.
A balanced scorecard includes productivity metrics (calls handled, AHT), quality metrics (FCR, satisfaction scores), and compliance metrics (call recording adherence, required disclosures). Weighting these appropriately prevents agents from gaming a single number.
Review scorecards with agents regularly. The data should start a conversation, not deliver a verdict. Ask what’s preventing better performance and what support would help.
Interaction Monitoring and Quality Assurance
Reporting tells you what happened. Quality assurance tells you how well it happened. For healthcare contact centers, QA isn’t optional—it’s a regulatory requirement.
The Problem with Manual QA Reviews
Most healthcare contact centers review between 1% and 5% of calls manually. A supervisor listens to a handful of interactions, scores them against a rubric, and hopes that sample represents the whole.
Here’s the problem: it doesn’t. Manual review at 3% coverage means 97% of your patient interactions go unreviewed. Somewhere in that unreviewed volume, agents are skipping required disclosures, providing inaccurate information, or creating compliance exposure.
Manual review also creates a timing problem. By the time a supervisor reviews a call from two weeks ago, the agent has handled hundreds more interactions. Feedback that arrives late changes nothing.
AI-Powered Speech Analytics
AI-powered speech analytics solve the coverage problem by scoring every call automatically. The technology transcribes conversations, analyzes sentiment, and flags interactions that need human review.
This isn’t about replacing supervisors—it’s about directing their attention. Instead of randomly sampling calls, supervisors can focus on the interactions that actually need review: escalations, complaints, compliance failures, and training opportunities.
Xima’s AI-powered auto QA analyzes 100% of patient interactions, not just a random sample. The speech analytics engine identifies patterns across thousands of calls that manual review would never catch.
Building a Compliance-Safe QA Program
Healthcare QA programs must balance quality improvement with privacy protection. Every call you record, store, and review potentially contains PHI. Your QA process needs guardrails.
Start with role-based access controls. Not everyone who needs to review QA scores needs access to call recordings. Limit recording access to supervisors with specific training on PHI handling.
Document your QA process thoroughly. If an auditor asks how you monitor compliance, you need to show them the policy, the procedure, and the evidence that you follow it consistently.
HIPAA Compliance in Contact Center Reporting
HIPAA compliance isn’t a feature you add to contact center reporting—it’s a requirement built into every aspect of how you collect, store, and analyze patient data.
What HIPAA Requires for Call Recording
HIPAA doesn’t prohibit call recording. It requires that recordings containing PHI be protected with appropriate administrative, physical, and technical safeguards.
Administrative safeguards include policies governing who can access recordings and under what circumstances. Physical safeguards protect the servers where recordings are stored. Technical safeguards include encryption, access controls, and audit logs.
Your recording retention policy matters too. HIPAA doesn’t specify how long to keep recordings, but many states have medical record retention requirements that may apply. Work with your compliance team to establish appropriate retention periods.
Audit Trail Requirements
An audit trail is a complete record of who accessed what data and when. For healthcare contact centers, audit trails are essential—both for HIPAA compliance and for operational accountability.
Your reporting system should log every query, every report export, and every time someone accesses a call recording. If a regulator asks who listened to a specific patient call, you need to answer that question definitively.
Xima’s cradle-to-grave reporting creates a complete audit trail for every patient interaction. From the moment a call enters the queue until wrap-up is complete, every touchpoint is documented and accessible.
Role-Based Access Controls
Not everyone in your contact center needs access to all data. A scheduler might need to see queue metrics but not call recordings. A supervisor might need recording access for their team but not for other departments.
Role-based access controls let you define permissions based on job function. This limits exposure when credentials are compromised and simplifies compliance documentation.
Review access permissions quarterly. As people change roles or leave the organization, permissions should change with them. Stale access rights are a common audit finding.
Cradle-to-Grave Reporting: Tracking the Complete Patient Journey
Most contact center reporting focuses on individual metrics in isolation. Cradle-to-grave reporting takes a different approach: tracking the complete lifecycle of each patient interaction from start to finish.
What Cradle-to-Grave Reporting Captures
Cradle-to-grave reporting documents every step of an interaction: how the patient reached you, what happened in the IVR, how long they waited in queue, which agents handled the call (including transfers), and how the interaction concluded.
This level of detail matters because patient complaints rarely involve a single moment. A patient who says “I was on hold forever and then got transferred three times” is describing a journey, not an event. To investigate, you need to see that journey.
Xima Software captures the complete interaction lifecycle in a single view. Instead of piecing together data from multiple systems, supervisors can see exactly what happened—from queue entry to wrap-up—in one report.
Using Cradle-to-Grave Data for Process Improvement
When you can see complete interaction journeys, patterns emerge that metrics alone would hide. You might discover that calls transferred from billing to scheduling have three times the handle time of direct calls. Or that patients who navigate to a specific IVR option abandon at higher rates.
These insights drive process improvement. Maybe the billing team needs a warm transfer protocol. Maybe that IVR option needs different routing. Cradle-to-grave data tells you where to focus.
Integrating with EHR Systems
Healthcare contact center reporting becomes more powerful when connected to your electronic health record system. EHR integration lets you link interaction data to patient records, creating a complete view of the patient relationship.
Xima integrates with over 70 EHR systems, enabling healthcare organizations to connect contact center data with clinical records. This integration helps your team understand each patient’s history before the call even begins.
How to Set Up Effective Reporting for Healthcare Contact Centers
Building a reporting program isn’t a one-time project—it’s an ongoing discipline. Here’s how to approach it systematically.
Step 1: Define Your Key Performance Indicators
Start by identifying the metrics that align with your organizational goals. If patient satisfaction is a priority, FCR and PSAT scores should feature prominently. If cost efficiency matters most, focus on AHT and calls per agent.
Limit your KPI list to metrics you’ll actually act on. A dashboard with 30 numbers gives you data paralysis, not insights. Pick 5-8 primary KPIs and track them consistently.
Document the definitions and calculation methods for each KPI. “Service level” means different things in different organizations. Make sure everyone is working from the same formula.
Step 2: Build Your Dashboard Framework
Create dashboards for different audiences with different needs. Supervisors need real-time data to manage queues. Directors need daily and weekly trends. Executives need monthly and quarterly summaries.
Each dashboard should answer specific questions. A supervisor dashboard answers “What do I need to do right now?” A director dashboard answers “Are we trending in the right direction?” An executive dashboard answers “Are we meeting our service commitments?”
Schedule regular dashboard reviews. A dashboard nobody looks at is worthless, no matter how well-designed.
Step 3: Establish Reporting Cadences
Different decisions require different timeframes. Real-time data drives immediate adjustments. Daily reports inform staffing decisions. Weekly reports shape coaching priorities. Monthly reports guide strategic planning.
Match your reporting cadence to your decision-making cadence. If you only review staffing monthly, daily staffing reports won’t change behavior.
Automate report distribution where possible. If a report has to be manually generated and emailed, it will eventually stop happening.
Step 4: Train Your Team on Data Interpretation
Reports are only useful if people know how to read them. Train supervisors on what the metrics mean, how to spot anomalies, and what actions to take when numbers fall outside acceptable ranges.
Create action playbooks tied to specific triggers. If service level drops below 70%, here’s what to do. If abandonment spikes above 8%, here’s who to call. Playbooks turn data into action.
Review reporting interpretations regularly. If supervisors are taking different actions based on the same data, your training or documentation needs work.
Advanced Analytics: Moving Beyond Basic Reporting
Basic reporting tells you what happened. Advanced analytics help you understand why it happened and predict what will happen next.
Predictive Analytics for Workforce Management
Predictive analytics use historical patterns to forecast future demand. For healthcare contact centers, this means anticipating call volume spikes before they happen.
Many healthcare organizations see predictable spikes: Monday mornings after weekend symptoms develop, flu season surge periods, open enrollment rushes. Predictive models quantify these patterns and help you staff accordingly.
The value compounds over time. The more historical data your model has, the more accurate the predictions become. Organizations that have tracked contact center data for years can forecast daily volume with surprising precision.
Sentiment Analysis and Voice of the Patient
Sentiment analysis uses AI to detect emotional tone in patient interactions. Are callers frustrated? Confused? Satisfied? Sentiment data adds a dimension that operational metrics miss.
Track sentiment alongside traditional metrics to spot disconnects. You might find that certain call types have good operational metrics but poor sentiment—suggesting the issue was resolved but the patient didn’t feel cared for.
Xima’s sentiment analysis capabilities identify emotional patterns across your call volume. The AI flags interactions where patient frustration escalated, helping supervisors prioritize their review queue.
Root Cause Analysis
When something goes wrong in your contact center, basic reporting tells you that it happened. Root cause analysis helps you understand why.
Effective root cause analysis requires drilling through multiple data layers. High abandonment isn’t the root cause—it’s the symptom. The root cause might be inadequate staffing, a system outage, a marketing campaign that drove unexpected volume, or an IVR change that confused callers.
Build root cause analysis into your incident response process. Every time a major metric falls outside bounds, document what happened, why it happened, and what you’ll do to prevent recurrence.
Choosing Contact Center Reporting Software for Healthcare
The market offers dozens of contact center reporting solutions. Here’s what to look for when evaluating options for healthcare.
Questions to Ask During Vendor Demos
Use these questions to evaluate any contact center reporting platform you’re considering:
“Show me the complete lifecycle of a single interaction in one view—from queue entry to wrap-up. Not a summary.” This tests whether the platform offers true cradle-to-grave visibility or just aggregated statistics.
“How does your system handle PHI in call recordings and transcriptions?” Any vendor selling to healthcare should have a clear answer about HIPAA compliance, data encryption, and access controls.
“Can you demonstrate the audit trail for a specific interaction?” Ask them to show you who accessed what data and when. If they can’t produce this on demand, their audit trail isn’t functional.
“What does implementation look like for an organization our size?” Generic answers suggest they haven’t done many healthcare implementations. Look for specific timelines and resource requirements.
If a vendor pivots away from any of these questions or redirects you to a different part of the demo, that’s your answer.
Integration Requirements
Healthcare contact centers don’t operate in isolation. Your reporting platform needs to connect with your phone system, EHR, CRM, and workforce management tools.
Ask about specific integrations, not just general compatibility. “We integrate with most EHRs” is different from “We have certified integrations with Epic, Cerner, and Meditech.” Specificity signals actual experience.
Test integrations during your evaluation. A vendor’s claim that integration is “quick and easy” should be verified before you sign anything.
Deployment Options: Cloud vs. On-Premises
Some healthcare organizations prefer cloud-based reporting for flexibility and reduced IT burden. Others require on-premises deployment to maintain complete control over patient data.
Xima offers both cloud and on-premises deployment options, giving healthcare organizations the flexibility to choose based on their compliance requirements and IT infrastructure. This matters because regulatory requirements and organizational policies vary widely across healthcare.
Consider hybrid approaches too. Some organizations keep call recordings on-premises while running analytics in the cloud. Your platform should support the architecture that works for your compliance requirements.
In Conclusion: Building a Reporting Foundation for Patient Service Excellence
Contact center reporting isn’t about generating numbers—it’s about creating visibility into patient experience. The metrics, dashboards, and analytics covered in this guide give you the tools to measure what matters and act on what you find.
For healthcare organizations, the stakes are higher than in other industries. Every unreviewed call potentially contains a compliance gap. Every abandoned call represents a patient who didn’t get help. Every long hold time erodes trust.
The question isn’t whether your healthcare contact center needs better reporting. The question is how long you’re willing to operate without it—and what you’re missing in the meantime.
Xima Software gives healthcare contact centers the reporting and analytics they need to close these gaps. With cradle-to-grave visibility, HIPAA-compliant data handling, and AI-powered quality assurance, you can finally see what’s happening across every patient interaction.
FAQs About Healthcare Contact Center Reporting
What is contact center reporting in healthcare?
Contact center reporting in healthcare is the process of tracking and analyzing patient interactions across phone, chat, and email channels. It measures metrics like hold times, call resolution rates, and patient satisfaction to improve service delivery.
Healthcare reporting also includes HIPAA compliance tracking and audit trail documentation for protected health information.
Which metrics matter most for healthcare call centers?
First call resolution, average handle time, call abandonment rate, and patient satisfaction scores are the most important metrics for healthcare contact centers. These KPIs directly correlate with patient experience and operational efficiency.
Track service level by time of day to identify staffing gaps during peak periods.
How does Xima help healthcare contact centers with reporting?
Xima gives healthcare contact centers cradle-to-grave reporting that captures every patient interaction from queue entry to wrap-up. The platform includes real-time wallboards, customizable dashboards, and AI-powered speech analytics that review 100% of calls.
Xima also integrates with over 70 EHR systems, connecting contact center data with patient records.
What is HIPAA-compliant contact center reporting?
HIPAA-compliant reporting includes encryption for stored and transmitted data, role-based access controls, complete audit trails, and secure handling of protected health information. Xima’s reporting platform is built with healthcare compliance requirements in mind.
Your platform should document who accessed what patient data and when.
What is cradle-to-grave reporting?
Cradle-to-grave reporting tracks the complete lifecycle of each patient interaction—from initial contact through resolution. This includes IVR navigation, queue wait times, transfers between agents, and after-call work.
Xima’s cradle-to-grave reporting shows the entire patient journey in a single view, eliminating the need to piece together data from multiple systems.
How does AI improve contact center quality assurance?
AI-powered QA analyzes 100% of calls automatically instead of the 1-5% sample that manual review covers. Speech analytics transcribes conversations, scores interactions, and flags compliance issues or coaching opportunities.
Xima’s AI-powered auto QA helps supervisors focus their attention on the calls that actually need human review.
Can contact center reporting integrate with EHR systems?
Yes, modern contact center reporting platforms can integrate with electronic health record systems. This integration links interaction data with patient records, giving agents context before calls and enabling more personalized service.
Xima integrates with over 70 EHR systems, enabling bi-directional data sharing between contact center and clinical platforms.