Your contact center generates thousands of data points every day. Calls come in, agents respond, customers hang up satisfied—or frustrated. Somewhere in that volume, patterns are forming that could tell you exactly where your operation is thriving and where it’s bleeding time and money. The question is whether you’re capturing the right metrics to see those patterns before problems compound.
Xima Software gives contact center managers the reporting tools to track every interaction from start to finish—what many in the industry call cradle-to-grave visibility. This guide breaks down the KPIs that matter most in 2026, explains how to interpret them, and shows you practical ways to turn reporting data into better customer service outcomes.
By the time you finish reading, you’ll understand which metrics deserve your attention, which ones are noise, and how modern analytics can shift your operation from reactive firefighting to proactive performance management.
Key Takeaways: Contact Center Reporting KPIs in 2026
- First Call Resolution and Average Handle Time remain foundational KPIs, but 2026 demands a more nuanced approach to measuring them.
- Real-time dashboards and wallboards let supervisors catch performance issues as they happen—not days or weeks later.
- Xima Software’s AI-powered analytics score 100% of interactions, eliminating the blind spots that come with manual QA sampling.
- Sentiment analysis and speech analytics add qualitative depth to traditional quantitative metrics for fuller performance pictures.
- The most valuable KPIs connect agent behavior directly to customer outcomes, not just operational efficiency numbers.
What Is Contact Center Reporting and Why Does It Matter?
Contact center reporting is the process of collecting, organizing, and analyzing data from your customer interactions. Every call, chat, email, and SMS creates a trail of information—how long the customer waited, how the agent handled the conversation, whether the issue was resolved, and how the customer felt about the experience.
Reporting turns that raw data into something you can act on. Without it, you’re making decisions based on assumptions. With it, you’re making decisions based on evidence.
The Gap Between Recording and Reporting
Here’s something that doesn’t get discussed often enough: recording interactions isn’t the same as reporting on them. Many contact centers have call recordings sitting in storage that nobody reviews. That’s raw material, not intelligence.
Reporting takes those recordings—along with metadata like timestamps, queue times, and disposition codes—and surfaces patterns you can use. It’s the difference between having security footage and having a summary of what happened.
What Changes When You Have Real Reporting Visibility
When reporting works the way it should, supervisors stop guessing about team performance. They can see which agents need coaching, which queues are bottlenecked, and which call types consume the most time. That visibility translates directly into operational improvements.
More importantly, real reporting lets you connect agent behavior to customer outcomes. You stop measuring activity for its own sake and start measuring what actually moves the needle on satisfaction and retention.
How Do You Define and Categorize Contact Center KPIs?
KPIs—Key Performance Indicators—are the specific metrics you track to evaluate whether your contact center is meeting its goals. Not every metric qualifies as a KPI. A KPI should directly connect to a business objective, be measurable and consistent, and change based on actions you can control.
The challenge is choosing which KPIs deserve your attention. Track too few and you’ll miss important signals. Track too many and you’ll drown in data without clear direction.
Operational KPIs vs. Customer Experience KPIs
Operational KPIs measure the efficiency of your contact center processes. They answer questions like: How quickly are we answering calls? How long do interactions take? How many customers abandon the queue before reaching an agent?
Customer experience KPIs measure how customers perceive their interactions with your team. They answer questions like: Did we solve the problem? Would the customer recommend us? How satisfied were they with the experience?
Both categories matter. Operational KPIs tell you how efficiently you’re running. Customer experience KPIs tell you whether that efficiency is actually serving your customers well.
Leading Indicators vs. Lagging Indicators
Leading indicators predict future performance. If your average speed of answer starts creeping up, that’s a signal that customer satisfaction scores will likely drop soon. If agent adherence to schedule decreases, call abandonment will probably rise.
Lagging indicators report what already happened. Customer satisfaction scores, NPS results, and monthly first call resolution rates are all lagging—they tell you the outcome after the fact.
Effective reporting tracks both. Leading indicators give you time to intervene before problems escalate. Lagging indicators confirm whether your interventions worked.
What Are the Most Important Contact Center KPIs to Track in 2026?
The KPIs that matter most depend on your specific business goals. A healthcare contact center handling patient scheduling has different priorities than a retail operation supporting e-commerce orders. That said, certain metrics have earned their place as foundational across most contact centers.
First Call Resolution (FCR)
First Call Resolution measures the percentage of customer issues resolved during the first interaction, without requiring a callback or transfer. FCR directly correlates with customer satisfaction—when customers get their problem solved on the first try, they’re significantly more likely to rate the experience positively.
To calculate FCR: Divide the number of issues resolved on first contact by the total number of issues handled, then multiply by 100.
The catch with FCR is defining what “resolved” means. Does the customer consider it resolved? Did the agent mark it resolved but the customer called back the next day about the same issue? Xima Software’s cradle-to-grave reporting connects related interactions so you can see whether the same customer contacts you again about the same topic—giving you a more accurate FCR picture.
Average Handle Time (AHT)
Average Handle Time measures the total duration of a customer interaction, including talk time, hold time, and after-call work. It’s one of the most commonly tracked contact center metrics, and also one of the most misunderstood.
Lower AHT isn’t automatically better. An agent who rushes through calls to keep handle time down might create more callbacks and lower satisfaction. An agent who takes slightly longer but resolves issues completely might deliver better outcomes overall.
AHT becomes useful when you combine it with other metrics. Track AHT alongside FCR to see whether shorter calls correlate with more repeat contacts. Track AHT by call type to identify which issues legitimately require more time.
Average Speed of Answer (ASA)
Average Speed of Answer measures how long customers wait in queue before reaching an agent. Long wait times frustrate customers and increase abandonment rates. Short wait times signal that you have adequate staffing to handle your volume.
ASA benchmarks vary by industry. A healthcare contact center might target answering within 30 seconds, while a technical support line might accept 60-90 seconds. What matters is knowing your target and tracking whether you’re hitting it consistently.
Call Abandonment Rate
Call abandonment rate measures the percentage of callers who hang up before reaching an agent. High abandonment rates indicate that customers are waiting too long and giving up—which means lost opportunities and frustrated customers who may take their business elsewhere.
To calculate abandonment rate: Divide the number of abandoned calls by the total number of incoming calls, then multiply by 100.
Many contact centers aim for abandonment rates under 5%. If yours is consistently higher, look at your ASA and staffing levels. Queue callback features—which let customers request a return call rather than waiting on hold—can significantly reduce abandonment by giving customers an alternative to waiting.
Service Level
Service level measures the percentage of calls answered within a target time threshold. The classic formulation is “80/20″—80% of calls answered within 20 seconds. Your specific target depends on your industry, customer expectations, and business model.
Service level differs from ASA because it’s a threshold metric. ASA tells you the average wait; service level tells you what percentage of calls met your acceptable wait standard. Both provide useful but different perspectives on your queue performance.
Customer Satisfaction Score (CSAT)
CSAT measures how satisfied customers are with a specific interaction. Typically collected through post-call surveys, CSAT asks customers to rate their experience on a scale (often 1-5 or 1-10). The score represents the percentage of customers who gave a positive rating.
CSAT is a lagging indicator—it tells you how customers felt after the fact. But it’s invaluable for understanding whether your operational metrics are translating into good customer experiences. High FCR and low AHT mean nothing if customers still leave unhappy.
Net Promoter Score (NPS)
NPS measures customer loyalty by asking one question: “How likely are you to recommend our company to a friend or colleague?” Respondents rate from 0-10. Scores of 9-10 are “promoters,” 7-8 are “passives,” and 0-6 are “detractors.” Your NPS is the percentage of promoters minus the percentage of detractors.
NPS captures broader sentiment than CSAT. A customer might be satisfied with a single interaction but still unlikely to recommend you based on overall experience. Tracking both gives you the full picture.
How Do You Track Agent Performance KPIs?
Agent performance KPIs help you identify who needs coaching, who’s ready for advancement, and where your training programs might have gaps. The goal isn’t to create a surveillance culture—it’s to give agents the feedback they need to improve and supervisors the visibility they need to support their teams effectively.
Agent Utilization Rate
Agent utilization measures the percentage of an agent’s scheduled time spent actively handling customer interactions versus being available but idle. High utilization (typically 80-85%) indicates efficient staffing. Very high utilization (above 90%) can signal burnout risk.
Utilization that’s too low suggests overstaffing or scheduling issues. Utilization that’s too high means agents don’t have breathing room between calls, which often leads to quality issues and turnover.
Adherence to Schedule
Schedule adherence tracks whether agents are logged in and available when they’re supposed to be. Contact center staffing models depend on having the right number of agents available at the right times. When adherence drops, service levels suffer.
Low adherence often signals process issues rather than agent problems. Maybe break schedules don’t align with call volume patterns. Maybe the system makes it difficult for agents to track their own schedules. Investigate the root cause before assuming it’s a performance issue.
Quality Assurance Scores
Quality scores measure how well agents handle interactions according to your defined standards. Traditionally, QA involved supervisors manually reviewing a sample of calls—typically 1-5% of an agent’s interactions—and scoring them against a checklist.
The problem with manual QA is coverage. When you only review a tiny fraction of calls, you’re making assumptions about the other 95-99%. A bad call that happens to fall outside your sample never gets caught.
Xima Software’s AI-powered auto QA scores 100% of interactions automatically, flagging issues in real-time and eliminating the sampling blind spot. Supervisors can focus their time on coaching and intervention rather than listening to random call recordings.
After-Call Work Time
After-call work (ACW) measures the time agents spend on tasks related to an interaction after the call ends—updating records, sending follow-up emails, processing requests. ACW is part of AHT, but tracking it separately helps you identify process inefficiencies.
If ACW is high across your team, look at your systems. Are agents navigating between multiple applications? Is data entry duplicated? CRM integrations that auto-populate information can significantly reduce ACW without asking agents to work faster.
What Role Does Real-Time Reporting Play in Contact Center Operations?
Historical reports tell you what happened yesterday, last week, or last month. Real-time reporting tells you what’s happening right now. Both serve important purposes, but real-time visibility is what allows you to intervene before small problems become big ones.
Real-Time Dashboards and Wallboards
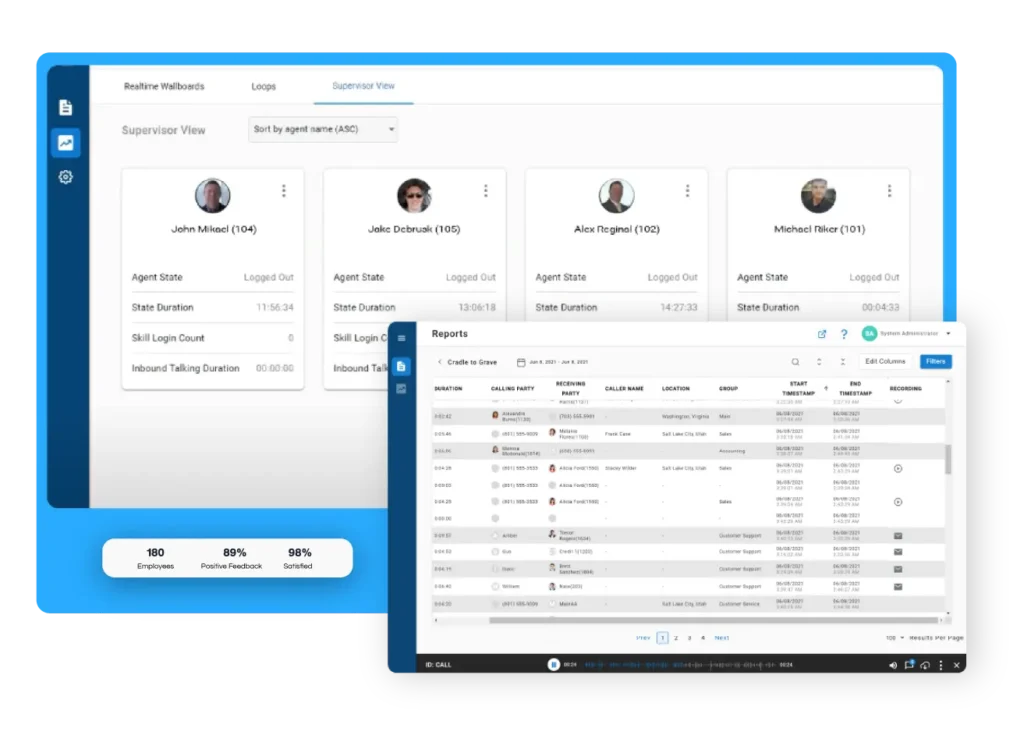
Real-time dashboards display current performance metrics in a visual format that supervisors (and often agents) can monitor throughout the day. Common dashboard elements include current queue depth, wait times, service level, and agent status.
Wallboards are larger displays, often mounted in the contact center where the whole team can see them. They create shared awareness of how the operation is performing and can motivate agents when metrics are trending positively.
Xima Software’s real-time wallboards and customizable dashboards let you choose exactly which metrics to display and how to visualize them. Supervisors can set threshold alerts that trigger notifications when metrics cross concerning lines—giving you time to respond before customers feel the impact.
Intraday Management
Intraday management uses real-time data to make staffing adjustments throughout the day. If call volume unexpectedly spikes, you might pull agents from offline tasks. If volume drops below forecast, you might approve break requests or schedule training sessions.
Effective intraday management requires accurate real-time data and the flexibility to act on it. If your reports lag by even 15-20 minutes, you’re always reacting to conditions that have already changed.
Alert-Based Intervention
The most sophisticated real-time reporting doesn’t just display metrics—it actively alerts supervisors when intervention is needed. An alert might fire when queue wait time exceeds a threshold, when a specific agent’s handle time is running unusually long, or when sentiment analysis detects a frustrated caller.
Alert-based intervention shifts supervisors from passive monitoring to active management. Instead of watching dashboards hoping to catch problems, they receive specific signals that direct their attention where it’s needed most.
How Can Speech Analytics Enhance Your KPI Tracking?
Traditional contact center metrics capture what happened: call duration, resolution status, customer rating. Speech analytics captures what was said and how—adding a qualitative layer that numbers alone can’t provide.
What Is Speech Analytics?
Speech analytics uses AI to transcribe and analyze the content of voice interactions. The technology converts audio to text, then applies natural language processing to identify topics, keywords, sentiment, and patterns across conversations.
Modern speech analytics can tell you not just that a call lasted 8 minutes, but what topics were discussed, whether the customer sounded frustrated or satisfied, whether the agent followed required compliance language, and whether competitive products were mentioned.
Sentiment Analysis in Contact Centers
Sentiment analysis evaluates the emotional tone of interactions—positive, negative, or neutral. It can track sentiment throughout a call, identifying moments where customer mood shifted and correlating those shifts with agent actions.
Sentiment data adds context to your other KPIs. A low CSAT score is a data point. Sentiment analysis showing that customers grew frustrated during hold times is actionable intelligence about why the score is low.
Compliance Monitoring Through Speech Analytics
Regulated industries—financial services, healthcare, insurance—often require agents to use specific disclosures, avoid certain phrases, and follow prescribed scripts. Manually verifying compliance across all calls is impossible at scale.
Speech analytics can automatically flag calls where required language was missing or prohibited phrases were used. This shifts compliance monitoring from sampling to comprehensive coverage, reducing regulatory risk without increasing supervisor workload.
How Do You Build an Effective Contact Center Reporting Strategy?
Having access to metrics isn’t the same as having a reporting strategy. A strategy defines which metrics matter for your specific goals, how often you’ll review them, who’s responsible for taking action, and how you’ll know if your efforts are working.
Start With Business Objectives
Every KPI you track should connect to a business objective. If your primary goal is reducing customer churn, prioritize metrics that predict and influence retention—FCR, CSAT, NPS. If your goal is operational efficiency, focus on AHT, utilization, and cost per contact.
List your top three business objectives for the contact center. Then identify which metrics most directly influence each objective. Those are your priority KPIs.
Choose the Right Reporting Frequency
Not every metric needs the same reporting cadence. Real-time dashboards for queue management. Daily reports for supervisor performance reviews. Weekly summaries for trend analysis. Monthly deep-dives for strategic planning.
Reporting too frequently creates noise—daily swings that don’t indicate real trends. Reporting too infrequently means you miss problems until they’ve compounded. Match the frequency to how quickly each metric changes and how quickly you can respond.
Define Ownership and Accountability
Every KPI should have an owner—someone responsible for monitoring the metric, investigating anomalies, and driving improvements. Without clear ownership, reports become informational rather than actionable.
Ownership doesn’t mean blame. The owner isn’t responsible for the metric hitting its target under all circumstances. The owner is responsible for understanding why the metric is where it is and recommending appropriate responses.
Establish Baselines and Targets
Before you can improve a metric, you need to know where you’re starting. Establish baselines by measuring current performance over a meaningful period—typically 30-90 days. Those baselines become your reference point for setting realistic targets.
Targets should be ambitious but achievable. An FCR target that’s 30 points above your baseline is probably unrealistic without major operational changes. A target 5-10 points above baseline gives your team something to work toward without setting them up for failure.
What Are the Most Common Contact Center Reporting Mistakes?
Even contact centers with sophisticated reporting tools make mistakes that undermine their KPI programs. Recognizing these common errors helps you avoid them in your own operation.
Tracking Too Many Metrics
When everything is a priority, nothing is. Some contact centers track dozens of KPIs, generating reports that nobody has time to read or act upon. The result is data overload without insight.
Focus on a core set of 5-8 KPIs that directly connect to your business objectives. You can track additional metrics for diagnostic purposes, but don’t give them equal weight in your reporting and review processes.
Confusing Activity With Outcomes
Activity metrics measure what agents do. Outcome metrics measure what results from what they do. A contact center obsessed with activity—calls handled, talk time, schedule adherence—might optimize for the wrong things.
An agent who handles fewer calls but resolves more issues might deliver better outcomes than one who rushes through high volume with low resolution. Balance activity metrics with outcome metrics like FCR and CSAT to get the full picture.
Ignoring Agent Input
Agents often understand why metrics are underperforming better than supervisors reviewing dashboards. They know which processes slow them down, which call types are challenging, and which tools don’t work as expected.
Include agents in your reporting reviews. Ask what obstacles they’re facing. Their frontline perspective often reveals root causes that data alone doesn’t show.
Optimizing Metrics in Isolation
Contact center KPIs are interconnected. Reducing AHT might increase callbacks, lowering FCR. Improving service level by overstaffing might tank your cost efficiency. Pushing agents for higher utilization might increase turnover.
Always consider how changes to one metric might affect others. The goal is optimizing the system, not individual metrics.
How Do You Use Contact Center Analytics to Drive Continuous Improvement?
Reporting is only valuable if it leads to action. The best contact center analytics programs build feedback loops that turn insights into improvements and improvements into measurable results.
Identify Performance Patterns
Look for patterns in your data rather than reacting to individual data points. Is AHT consistently higher on Monday mornings? Does abandonment spike during lunch hours? Do certain call types consistently take longer than others?
Patterns reveal systemic issues. A single bad call is an incident. A pattern of bad calls of a certain type indicates a process or training gap worth addressing.
Connect Metrics to Coaching
Individual agent metrics should feed directly into coaching conversations. When an agent’s FCR is below team average, the coaching conversation should explore why—not just push for improvement without understanding the obstacle.
AI-powered QA tools like those in Xima CCaaS can identify specific coaching opportunities by analyzing interaction content. Instead of “your handle time is too high,” the conversation becomes “you’re spending extra time on these specific call types—let’s talk about approaches that might help.”
Test and Measure Changes
When you make operational changes—new scripts, different routing, updated processes—measure the impact. Compare KPIs before and after the change. Look for both intended effects and unintended consequences.
This test-and-measure approach turns your contact center into a continuous improvement system. Each change either validates a hypothesis or teaches you something new about your operation.
Share Results Across the Organization
Contact center data often has implications beyond the contact center itself. High call volume about a specific product issue might signal a quality problem. Common customer complaints might indicate marketing messaging that’s setting wrong expectations.
Share relevant reporting insights with product teams, marketing, operations, and leadership. The contact center sits at the intersection of customer experience and company operations—the data it generates has value across the organization.
What Should You Look for in Contact Center Reporting Software?
The tools you use shape what insights you can extract. When evaluating contact center reporting solutions, focus on capabilities that match your specific operational needs.
Cradle-to-Grave Visibility
Look for reporting that tracks interactions from start to finish—across transfers, queue changes, and agent handoffs. Without cradle-to-grave visibility, your data fragments when calls move between agents or departments, giving you an incomplete picture.
Xima Software built its reporting around this cradle-to-grave approach specifically because fragmented call data was creating blind spots for contact center managers trying to understand what was actually happening in their operations.
Real-Time and Historical Reporting
You need both. Real-time reporting for operational management in the moment. Historical reporting for trend analysis and strategic planning. Platforms that only excel at one leave you with gaps in the other.
Customizable Dashboards and Reports
Every contact center has different priorities. Your reporting tools should let you build dashboards and reports around your specific KPIs, not force you into predefined templates that don’t match your needs.
Look for drag-and-drop dashboard builders, flexible report parameters, and the ability to save and schedule custom reports for regular distribution.
Integration With Your Existing Systems
Reporting becomes more powerful when it connects to your CRM, workforce management, and communication platforms. Integrations eliminate manual data entry, reduce errors, and provide richer context for your metrics.
Check whether reporting solutions offer native integrations with your existing tech stack or require middleware and custom development.
AI and Automation Capabilities
Manual analysis can’t scale to 100% of interactions. AI-powered speech analytics, sentiment analysis, and automated QA scoring let you derive insights from your entire interaction volume—not just a small sample.
These capabilities have moved from “nice to have” to essential for contact centers that want comprehensive visibility into their operations.
In Conclusion: Building a KPI Strategy That Drives Real Results
Contact center reporting KPIs aren’t just numbers on a dashboard. They’re the signals that tell you whether your operation is serving customers well, whether your agents have what they need to succeed, and whether your investments in technology and training are paying off.
The metrics that matter most in 2026 connect agent behavior to customer outcomes. FCR, AHT, and service level remain foundational—but they gain meaning when paired with CSAT, NPS, and sentiment analysis that reveal the customer perspective.
Effective reporting requires more than just collecting data. It requires choosing the right metrics for your goals, establishing ownership and accountability, and building feedback loops that turn insights into improvements.
Xima Software helps contact centers of all sizes get the visibility they need—from real-time wallboards that show current performance to AI-powered analytics that score every interaction. The platform was built around the principle that better data leads to better decisions, and better decisions lead to better customer experiences.
The question isn’t whether you need contact center reporting. The question is whether your current reporting gives you the visibility to make smart decisions—or leaves you guessing about what’s actually happening when your team interacts with customers.
FAQs About Contact Center Reporting KPIs in 2026
What is the most important KPI for contact centers?
First Call Resolution (FCR) is often considered the most impactful KPI because it directly correlates with customer satisfaction and operational efficiency. When you resolve issues on the first contact, customers are happier and you avoid the cost of repeat interactions.
That said, no single KPI tells the whole story. Xima Software’s reporting dashboards let you track FCR alongside related metrics like CSAT and AHT so you can see the full picture of how your contact center is performing.
How do you calculate call abandonment rate?
Divide the number of abandoned calls by the total number of incoming calls, then multiply by 100. For example, if you received 1,000 calls and 50 were abandoned, your abandonment rate is 5%.
Most contact centers aim for abandonment rates under 5%. Queue callback features—which Xima CCaaS includes—can reduce abandonment by giving customers an alternative to waiting on hold.
What is the difference between ASA and service level?
Average Speed of Answer (ASA) measures the mean time customers wait before reaching an agent. Service level measures the percentage of calls answered within a target threshold—for example, 80% of calls answered within 20 seconds.
ASA gives you an average; service level tells you how consistently you’re meeting your target. Both metrics are useful for understanding queue performance from different angles.
How many KPIs should a contact center track?
Focus on 5-8 core KPIs that directly connect to your business objectives. You can track additional metrics for diagnostic purposes, but your primary reporting should center on a manageable set that your team can realistically monitor and act upon.
Too many KPIs create noise and diffuse attention. Too few leave blind spots in your visibility.
What is cradle-to-grave reporting?
Cradle-to-grave reporting tracks interactions from the moment they enter your contact center until they’re fully resolved—including transfers, queue changes, and callbacks related to the same issue. This approach eliminates the fragmented data that occurs when calls move between agents or departments.
Xima Software’s cradle-to-grave reporting gives you accurate metrics even for complex interactions that touch multiple agents or span multiple contacts.
How does AI improve contact center reporting?
AI enables analysis at scale that’s impossible manually. Speech analytics can transcribe and analyze 100% of voice interactions. Sentiment analysis can detect customer emotion in real-time. Automated QA scoring can evaluate every call against your quality standards.
Xima Software’s AI-powered analytics eliminate the sampling blind spot that comes with manual QA, giving supervisors visibility into their entire interaction volume rather than a small percentage.
What is the ideal first call resolution rate?
FCR benchmarks vary by industry and call type, but most contact centers target FCR rates between 70-80%. Some high-performing centers achieve rates above 85% for straightforward inquiries.
More important than hitting an arbitrary benchmark is understanding your own baseline and working to improve it. Track which call types have lower FCR and investigate the root causes—training gaps, system limitations, or process issues that require escalation.
How often should contact centers review their KPIs?
Match review frequency to how quickly metrics change and how quickly you can respond. Real-time dashboards for operational decisions. Daily reviews for performance management. Weekly analysis for trend identification. Monthly deep-dives for strategic planning.
Xima Software supports all these cadences with real-time wallboards, scheduled reports, and historical analytics that let you examine data at whatever timeframe makes sense for each use case.